Andrea Blotkamp and Tina Harris present the first clinical audit report of the National Maternity and Perinatal Audit.
The national maternity and perinatal Audit (NMPA) provides an unprecedented opportunity for maternity services to compare local care and outcomes with national means and with other services, and to share good practice and identify areas for improvement. The first clinical audit report of the NMPA appeared in November, presenting for the first time a range of measures based directly on data entered in women’s electronic maternity records – mostly by midwives.
The Healthcare Quality Improvement Partnership (HQIP) commissioned the NMPA on behalf of NHS England and the Scottish and Welsh governments. It consists of a continuous clinical audit, an organisational survey and a programme of periodic audits on specific topics (‘sprint audits’). The first organisational survey report was published in August 2017.
How was the audit conducted?
The clinical audit covers a number of key measures to identify unexpected variation between maternity service providers or regions. These measures were developed using an iterative process with consultation from external stakeholders, including women who used maternity services. The final selection of the measures for the first year of the audit took into account the availability and quality of the data needed to calculate each maternity service’s rate, and to adjust for factors beyond the control of the service, such as age, ethnicity, socioeconomic deprivation and pre-existing conditions, which may contribute to variation between organisations.
All NHS trusts and boards providing intrapartum care on-site across England, Scotland and Wales were eligible to take part, and electronic maternity record data were received for 97% of these (130 English trusts, 14 Scottish boards and seven Welsh boards). To maximise the information available about each pregnancy and birth, these data were linked with English Hospital Episode Statistics, Scottish Birth and Morbidity Records and the Patient Episode Database for Wales. The NMPA has captured an estimated 92% of births that took place between 1 April 2015 and 31 March 2016 – nearly 700,000 in total.
Data collection for the second round of the audit is now underway. The intention is to expand the set of measures: for example, by linking the NMPA dataset to neonatal datasets. As the NMPA will publish figures every year, maternity services will be able to monitor trends over time.
Maternity data quality
Maternity services do not all routinely collect the same information, and even where information is collected, quality and completeness often varies between services. Some key data items have a high level of completeness, such as gestational age, birthweight and mode of birth, but others less so, including labour onset, labour analgesia and anaesthesia, augmentation and fetal presentation. This means that the NMPA could not include some important measures this year, including the composite measure, birth without intervention, which relies on accurate recording of not only mode of birth but also most of the less well-recorded data items mentioned above.
The electronic data recorded mainly cover booking and the period of labour and birth, with little information on events during pregnancy and the postnatal period. This makes it difficult to evaluate care during these periods and to interpret some labour events.
Audit results
The audit data confirm trends that many midwives will have observed in practice: fewer than half of pregnant women (47.3%) have a body mass index (BMI) within the normal range and over a fifth (21.3%) have a booking BMI of 30 or over. The average age of women having their first baby is 28, while 2.7% of first-time mothers are aged 40 or over.
In England, an estimated 86.6% of women gave birth in an obstetric unit (OU), 10.2% in an alongside midwifery unit (AMU), 1.6% in a freestanding midwifery unit and 1.4% at home (of women for whom place of birth could be determined. Separate information on the place of birth to distinguish between co-located OUs and AMUs was not consistently available for Scotland and Wales). Since more than two-thirds of OUs are now co-located with an AMU (NMPA, 2017), and an estimated 45% of women are at low risk of complications at the end of their pregnancy (Sandall et al, 2014), there appears to be scope for a further increase in the number of women giving birth in midwife-led settings.
Among women with a term singleton baby in cephalic position, 29.4% underwent induction of labour, 66% had a spontaneous vaginal birth, 13.6% an instrumental birth and 20.3% a CS birth. Even after case-mix adjustment, the variation in rates of induction and modes of birth was wide, suggesting that differences in practice play a part. Also, no clinical indication was recorded for more than a quarter of term babies (29%) who were born following induction or elective CS before 39 weeks.
The NMPA has enabled national reporting of several key outcomes for the first time, including obstetric haemorrhage of 1500ml or over (mean 2.6% among women who gave birth to term, singleton, cephalic babies), third- and fourth-degree tears (mean 3.5% among women who gave birth vaginally to term, singleton, cephalic babies) and Apgar scores of less than seven at five minutes (mean 1.2% among liveborn, term, singleton, cephalic babies). Variation in rates of these outcomes is slightly less pronounced than for induction and modes of birth. Nonetheless, some maternity services sites had higher rates than the expected range.
The rates of babies receiving skin-to-skin contact with their mothers, and in particular of babies receiving breastmilk at their first feed and at discharge from the maternity unit, varies widely (both ranging from around 45% to 100%). Some services have very high rates, but others surprisingly low rates. Resources may play a part in support for breastfeeding in particular.
What do the results mean?
The NMPA results present an opportunity for maternity services to examine their results in comparison with national means and with similar services across the country. Rather than interpreting individual measures in isolation, they should consider the measures together, within their organisational context and the national context, in order to evaluate if and how they interact.
Where results are considerably different from the mean, they should investigate the possible reasons for this, including data accuracy. A low rate of an adverse outcome could represent a degree of under-diagnosis.
The generally high quality of the electronic maternity record data has enabled national reporting on a number of key measures. Continued improvement of data quality and completeness, supported by adequate resources, will allow further insight into the care that maternity services provide.
Use the online data
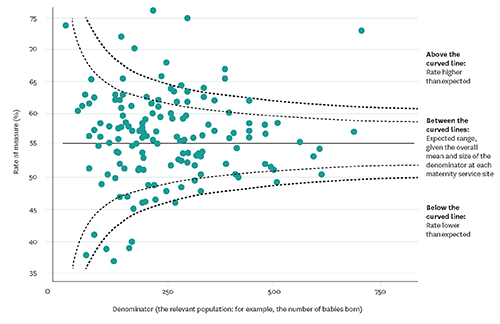
As well as downloading the full clinical and organisational reports, you can access the results of the audit on the NMPA website. You can compare maternity service sites, trusts/boards, local maternity systems/regions and countries. At site level you can view funnel plots (see page opposite for an explanation of how to read these) of single measures and spine charts that give an overview of all measures. You can also find out how each measure was constructed.
You can use this information to benchmark your maternity service against the national mean, and to compare it with others of a similar size. You can also use the organisational data area of the website to identify services across the country that are comparable in other ways – for example, available birth settings or neonatal services. See www.maternityaudit.org.uk/pages/continuousaudit for more.
Andrea Blotkamp is a clinical fellow (midwifery) at the NMPA and Tina Harris is senior clinical lead for midwifery at the NMPA